Markets: the biggest moves and the weekly recap
Every Saturday this page sums up the week in the markets that matter most to a trader: EUR/USD, the US 10-year Treasury yield, bitcoin, ether and the ECB and Fed rates. And every day when something moves much more than usual is recorded with its figure and context.
What counts as a big move under the current criteria: EUR/USD changing 1% or more in a day; bitcoin, 7%; ether, 9%; the 10-year yield, 15 basis points; WTI crude, 5%; the S&P 500 or the Dow, 2%, and the Nasdaq, 2.5%. Also the VIX crossing 30 points or jumping 30% in a day, and each new all-time closing high of the three big US indices after at least ten sessions without one.
The latest figure
Weekly market recap, week 43: euro, dollar, bonds and crypto (October 23, 2026)
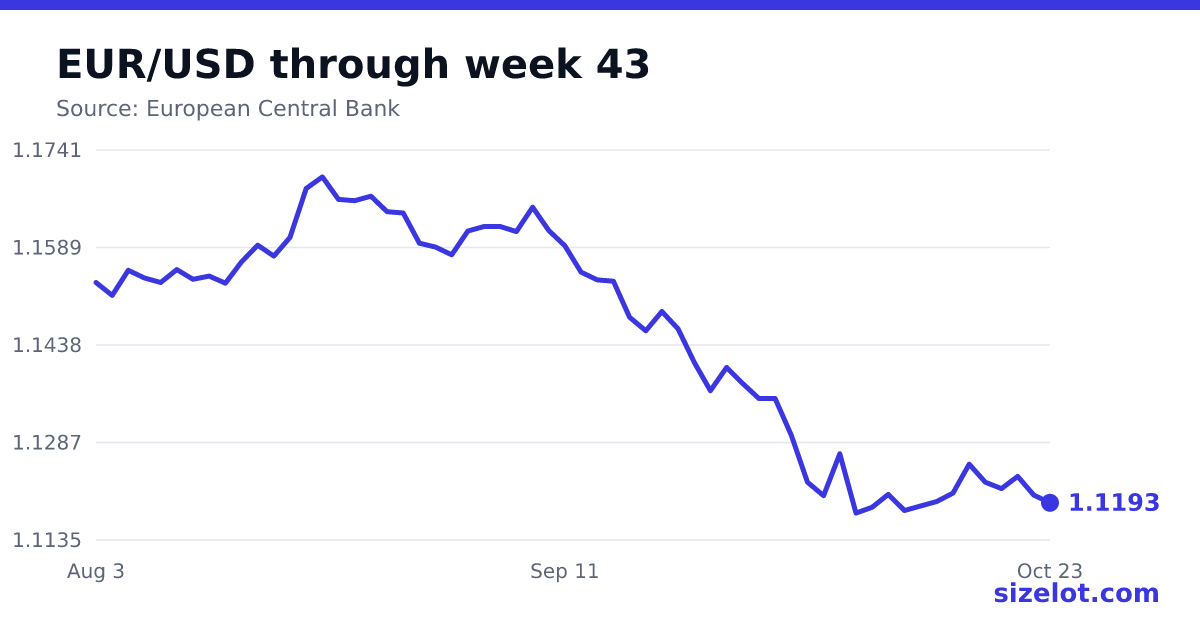
In the week to October 23, 2026, the biggest mover was BTC, at -1.13%. The euro ended at 1.1193 dollars at the ECB fixing and the US 10-year yield at 5.00%. Official rates at the end of the week: ECB 2.50% (deposit) and Fed 3.75–4.00%.
| Market | Previous week | This week | Change |
|---|---|---|---|
| EUR/USD | 1.1253 | 1.1193 | -0.53% |
| GBP/USD | 1.3335 | 1.3368 | +0.25% |
| USD/JPY | 158.02 | 156.80 | -0.77% |
| US 2-year yield | 4.74% | 4.69% | −5 bp |
| US 10-year yield | 5.09% | 5.00% | −9 bp |
| BTC/USDT | $82,116 | $81,189 | -1.13% |
| ETH/USDT | $2,410 | $2,388 | -0.94% |
| S&P 500 | 7,659.44 | 7,757.17 | +1.28% |
| Nasdaq Composite | 26,140.03 | 25,955.34 | -0.71% |
| WTI crude | $108.21 | $107.89 | -0.30% |
| VIX | 19.99 | 19.03 | -4.80% |
Size each trade to your risk with the lot size calculator and check the central bank calendar.
Weekly recaps
| Date | What happened | Figure |
|---|---|---|
| Weekly market recap, week 43: euro, dollar, bonds and crypto | Biggest mover: BTC (-1.13%). | |
| Weekly market recap, week 42: euro, dollar, bonds and crypto | Biggest mover: ETH (-4.47%). | |
| Weekly market recap, week 41: euro, dollar, bonds and crypto | Biggest mover: ETH (-8.77%). | |
| Weekly market recap, week 40: euro, dollar, bonds and crypto | Biggest mover: EUR/USD (-1.56%). | |
| Weekly market recap, week 39: euro, dollar, bonds and crypto | Biggest mover: BTC (+3.60%). | |
| Weekly market recap, week 38: euro, dollar, bonds and crypto | Biggest mover: ETH (+5.45%). | |
| Weekly market recap, week 37: euro, dollar, bonds and crypto | Biggest mover: BTC (-3.88%). | |
| Weekly market recap, week 36: euro, dollar, bonds and crypto | Biggest mover: BTC (+2.55%). | |
| Weekly market recap, week 35: euro, dollar, bonds and crypto | Biggest mover: ETH (-0.84%). | |
| Weekly market recap, week 34: euro, dollar, bonds and crypto | Biggest mover: ETH (+34.13%). | |
| Weekly market recap, week 33: euro, dollar, bonds and crypto | Biggest mover: BTC (-2.86%). | |
| Weekly market recap, week 32: euro, dollar, bonds and crypto | Biggest mover: BTC (+2.13%). | |
| Weekly market recap, week 31: euro, dollar, bonds and crypto | Biggest mover: ETH (-4.71%). | |
| Weekly market recap, week 30: euro, dollar, bonds and crypto | Biggest mover: BTC (-0.90%). | |
| Weekly market recap, week 29: euro, dollar, bonds and crypto | Biggest mover: ETH (+1.94%). |
Big moves and records
| Date | What happened | Figure |
|---|---|---|
| The US 10-year Treasury yield falls 17 basis points to 4.96% | From 5.13% to 4.96% in one session. | |
| Stocks fall: the S&P 500 loses 1.2% and the Nasdaq 2.6% | The S&P 500, -1.21% in one session. | |
| WTI crude jumps 8.7% to $104.71 a barrel | From $96.34 to $104.71 a barrel. | |
| The S&P 500 hits a new record close: 7,818.93 | New record close: 7,818.93. | |
| WTI crude jumps 16.6% to $99.37 a barrel | From $85.23 to $99.37 a barrel. | |
| WTI crude drops 11.1% to $85.23 a barrel | From $95.88 to $85.23 a barrel. | |
| The US 10-year Treasury yield rises 15 basis points to 5.11% | From 4.96% to 5.11% in one session. | |
| The Nasdaq hits a new record close: 27,122.09 | New record close: 27,122.09. | |
| WTI crude jumps 6.5% to $103.57 a barrel | From $97.26 to $103.57 a barrel. | |
| WTI crude jumps 5.1% to $91.48 a barrel | From $87.03 to $91.48 a barrel. | |
| Bitcoin jumps 7.3% in a day and closes at $78,338 | From $73,025 to $78,338 in one session. | |
| Bitcoin jumps 7.1% in a day and closes at $69,335 | From $64,725 to $69,335 in one session. | |
| Ether jumps 17.5% in a day and closes at $2,253 | From $1,918 to $2,253 in one session. | |
| WTI crude jumps 5.0% to $83.76 a barrel | From $79.77 to $83.76 a barrel. | |
| WTI crude drops 5.6% to $77.33 a barrel | From $81.96 to $77.33 a barrel. | |
| The S&P 500 hits a new record close: 7,736.52 | New record close: 7,736.52. | |
| Stocks rally: the S&P 500 gains 1.8% and the Nasdaq 2.6% | The S&P 500, +1.79% in one session. | |
| The Dow Jones hits a new record close: 53,178.41 | New record close: 53,178.41. | |
| Stocks rally: the S&P 500 gains 1.7% and the Nasdaq 2.8% | The S&P 500, +1.66% in one session. | |
| WTI crude jumps 6.4% to $86.08 a barrel | From $80.91 to $86.08 a barrel. | |
| Stocks fall: the S&P 500 loses 1.5% and the Nasdaq 1.7% | The S&P 500, -1.52% in one session. | |
| WTI crude drops 8.2% to $84.25 a barrel | From $91.74 to $84.25 a barrel. | |
| WTI crude jumps 6.2% to $93.08 a barrel | From $87.66 to $93.08 a barrel. | |
| WTI crude jumps 9.3% to $79.20 a barrel | From $72.45 to $79.20 a barrel. |
Why the size of a move matters
The size of a move only makes sense against what is normal. A 2% day in the S&P 500 is rare; a 2% day in bitcoin is ordinary. That is why each recorded move comes with its recent volatility: how many times bigger it was than a typical day.
The same idea applies to trading. When volatility rises, stops should be wider and positions smaller so you risk the same money. The lot size and futures calculators do that sum with the stop you choose. For the background, the S&P 500, gold and bitcoin guides explain what drives each market.
The data comes from official and public sources (the ECB, the US Treasury, FRED and Binance), is checked every morning, and nothing is published if a figure is implausible. This is not investment advice.
To use with this data: Lot size calculator · Futures calculator · S&P 500 guide · Bitcoin guide.
Information based on published official data. This is not investment advice: leveraged trading can lose you more than you invest.
Frequently asked questions
What is the latest figure?
Weekly market recap, week 43: euro, dollar, bonds and crypto (October 23, 2026). Biggest mover: BTC (-1.13%).
What counts as a big S&P 500 move?
On this site, a change of 2% or more in a day. It happens only a few times a year in normal conditions.
What is the VIX?
The S&P 500 volatility index, known as the “fear index”. Above 30 points it signals a very nervous market.