US economic data: inflation (CPI), jobs and GDP
Three US releases move markets worldwide every month: inflation, jobs and growth. They are what the Federal Reserve watches to set rates, so each one changes what the market expects from its next meeting.
The CPI is published by the Bureau of Labor Statistics (BLS) around the middle of the month, with the change in prices in the month before; traders watch both the headline and the core figure, which leaves out food and energy. The jobs report comes from the same agency, usually on the first Friday of the month: nonfarm payrolls and the unemployment rate. GDP is published by the Bureau of Economic Analysis (BEA) every quarter as an annualized rate, with an advance estimate about a month after the quarter ends and two revisions. All three come out at 8:30 a.m. Eastern time.
The latest figure
US CPI for September 2026: inflation rises to 3.7% (October 15, 2026)
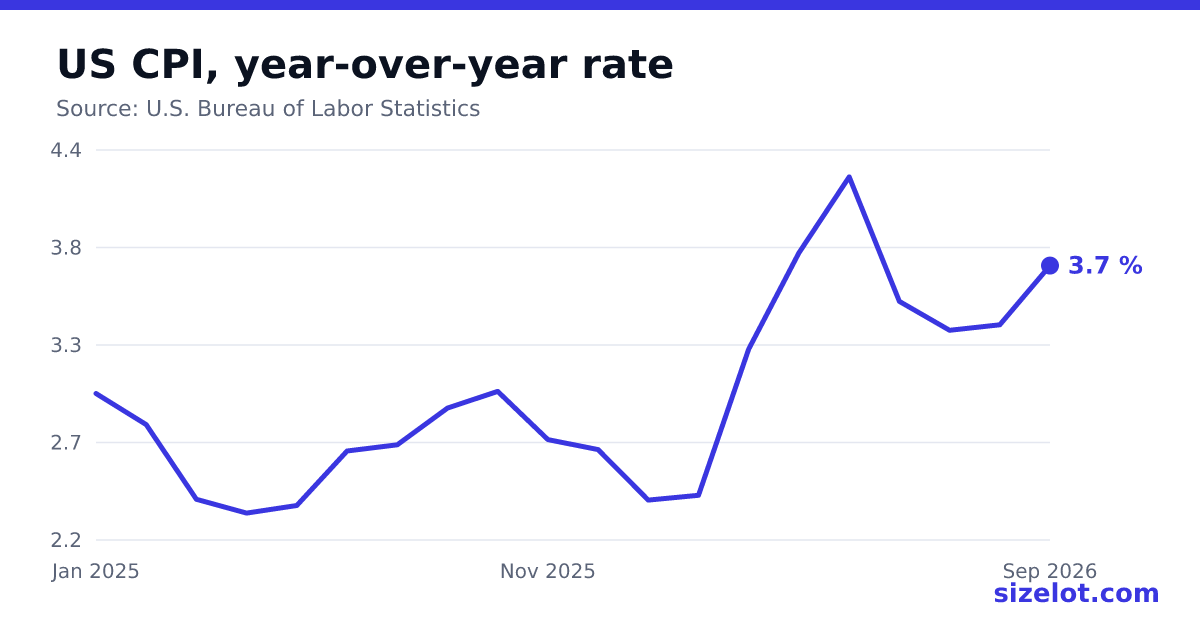
The US consumer price index (CPI-U, all items) rose 3.7% in the twelve months to September 2026, according to the Bureau of Labor Statistics (BLS). In August 2026 the rate was 3.4%. The index stood at 336.940 points.
| Month | Annual rate |
|---|---|
| September 2026 | 3.7% |
| August 2026 | 3.4% |
| July 2026 | 3.4% |
| June 2026 | 3.5% |
| May 2026 | 4.2% |
| April 2026 | 3.8% |
| March 2026 | 3.3% |
| February 2026 | 2.4% |
| January 2026 | 2.4% |
| December 2025 | 2.7% |
| November 2025 | 2.7% |
| September 2025 | 3.0% |
The inflation report comes out at 8:30 New York time and is one of the releases that moves the dollar, gold and indices most within minutes: many prop firms restrict trading right at that moment. Prop firm news rules.
Inflation (CPI)
| Date | What happened | Figure |
|---|---|---|
| US CPI for September 2026: inflation rises to 3.7% | 3.7% year over year, from 3.4%. | |
| US CPI for August 2026: inflation holds at 3.4% | 3.4% year over year, from 3.4%. | |
| US CPI for July 2026: inflation eases to 3.4% | 3.4% year over year, from 3.5%. | |
| US CPI for June 2026: inflation eases to 3.5% | 3.5% year over year, from 4.2%. | |
| US CPI for May 2026: inflation rises to 4.2% | 4.2% year over year, from 3.8%. | |
| US CPI for April 2026: inflation rises to 3.8% | 3.8% year over year, from 3.3%. | |
| US CPI for March 2026: inflation rises to 3.3% | 3.3% year over year, from 2.4%. | |
| US CPI for February 2026: inflation holds at 2.4% | 2.4% year over year, from 2.4%. | |
| US CPI for January 2026: inflation eases to 2.4% | 2.4% year over year, from 2.7%. | |
| US CPI for December 2025: inflation holds at 2.7% | 2.7% year over year, from 2.7%. | |
| US CPI for November 2025: inflation eases to 2.7% | 2.7% year over year, from 3.0%. |
Jobs
| Date | What happened | Figure |
|---|---|---|
| US jobs report for September 2026: +29,000 payrolls and 4.2% unemployment | +29,000 jobs; 4.2% unemployment. | |
| US jobs report for August 2026: +133,000 payrolls and 4.1% unemployment | +133,000 jobs; 4.1% unemployment. | |
| US jobs report for July 2026: −10,000 payrolls and 4.1% unemployment | −10,000 jobs; 4.1% unemployment. | |
| US jobs report for June 2026: +31,000 payrolls and 4.2% unemployment | +31,000 jobs; 4.2% unemployment. | |
| US jobs report for May 2026: +63,000 payrolls and 4.3% unemployment | +63,000 jobs; 4.3% unemployment. | |
| US jobs report for April 2026: +148,000 payrolls and 4.3% unemployment | +148,000 jobs; 4.3% unemployment. | |
| US jobs report for March 2026: +214,000 payrolls and 4.3% unemployment | +214,000 jobs; 4.3% unemployment. | |
| US jobs report for February 2026: −156,000 payrolls and 4.4% unemployment | −156,000 jobs; 4.4% unemployment. | |
| US jobs report for January 2026: +160,000 payrolls and 4.3% unemployment | +160,000 jobs; 4.3% unemployment. | |
| US jobs report for December 2025: −17,000 payrolls and 4.4% unemployment | −17,000 jobs; 4.4% unemployment. | |
| US jobs report for November 2025: +41,000 payrolls and 4.5% unemployment | +41,000 jobs; 4.5% unemployment. |
GDP
| Date | What happened | Figure |
|---|---|---|
| US GDP grows at a 2.2% annual rate in the second quarter of 2026 | 2.2% annualized, from 2.5%. | |
| US GDP grows at a 2.5% annual rate in the first quarter of 2026 | 2.5% annualized, from 0.2%. | |
| US GDP grows at a 0.2% annual rate in the fourth quarter of 2025 | 0.2% annualized, from 3.9%. | |
| US GDP grows at a 3.9% annual rate in the third quarter of 2025 | 3.9% annualized, from 4.0%. |
How they move markets
What counts is the surprise: the gap between the figure and what analysts expected. A hotter CPI or a stronger jobs report tends to mean higher rates for longer: the dollar rises, bonds fall (their yield rises) and indices like the Nasdaq suffer. A weaker figure tends to do the opposite. Gold, which pays no interest, usually rises when rate cuts are expected.
In the minute of the release, EUR/USD, gold and S&P 500 futures can move sharply, with wider spreads. Many prop firms restrict trading in the minutes around these releases: check your firm’s rules on its prop firm page.
This page updates itself on each release day, with the figures read from the BLS and the BEA and checked before publishing.
To use with this data: Fed interest rates · Gold lot size calculator · Prop firm rules.
Information based on published official data. This is not investment advice: leveraged trading can lose you more than you invest.
Frequently asked questions
What is the latest figure?
US CPI for September 2026: inflation rises to 3.7% (October 15, 2026). 3.7% year over year, from 3.4%.
What time is the US CPI released?
At 8:30 a.m. Eastern time, around the middle of the month.
What is core CPI?
CPI excluding food and energy, the most volatile prices. The Fed watches it for the underlying trend of inflation.
When is the jobs report released?
Usually on the first Friday of each month at 8:30 a.m. Eastern time.